Map matching in R
Introducing the forthcoming ‘mapmatchr’ package
Ashirwad Barnwal
2022-02-24
What is map matching?
What is map matching?
It's the process of matching noisy GPS data to the most probable travel route.
What is map matching?
It's the process of matching noisy GPS data to the most probable travel route.

Who are interested in map matching and why?
Who are interested in map matching and why?
Not surprisingly, anybody who deals with GPS data!
Who are interested in map matching and why?
Not surprisingly, anybody who deals with GPS data!
- Auto insurance companies: Crash risk assessment (e.g., Are drivers often driving through high crash risk roads? Do we need to adjust premiums?)
Who are interested in map matching and why?
Not surprisingly, anybody who deals with GPS data!
Auto insurance companies: Crash risk assessment (e.g., Are drivers often driving through high crash risk roads? Do we need to adjust premiums?)
Highway agencies: Streamline winter maintenance efforts (e.g., Are snowplows serving the same route multiple times? Can they be directed somewhere else?)
Transportation researchers: Travel pattern analyses (e.g., Do older drivers with cognition and/or vision problem(s) prefer one route over another?)
How can we perform map matching?
| Four popular options |
|---|
| Google Snap to Roads API |
| Mapbox Map Matching API |
| QGIS Plugin |
| Fast Map Matching (FMM) |
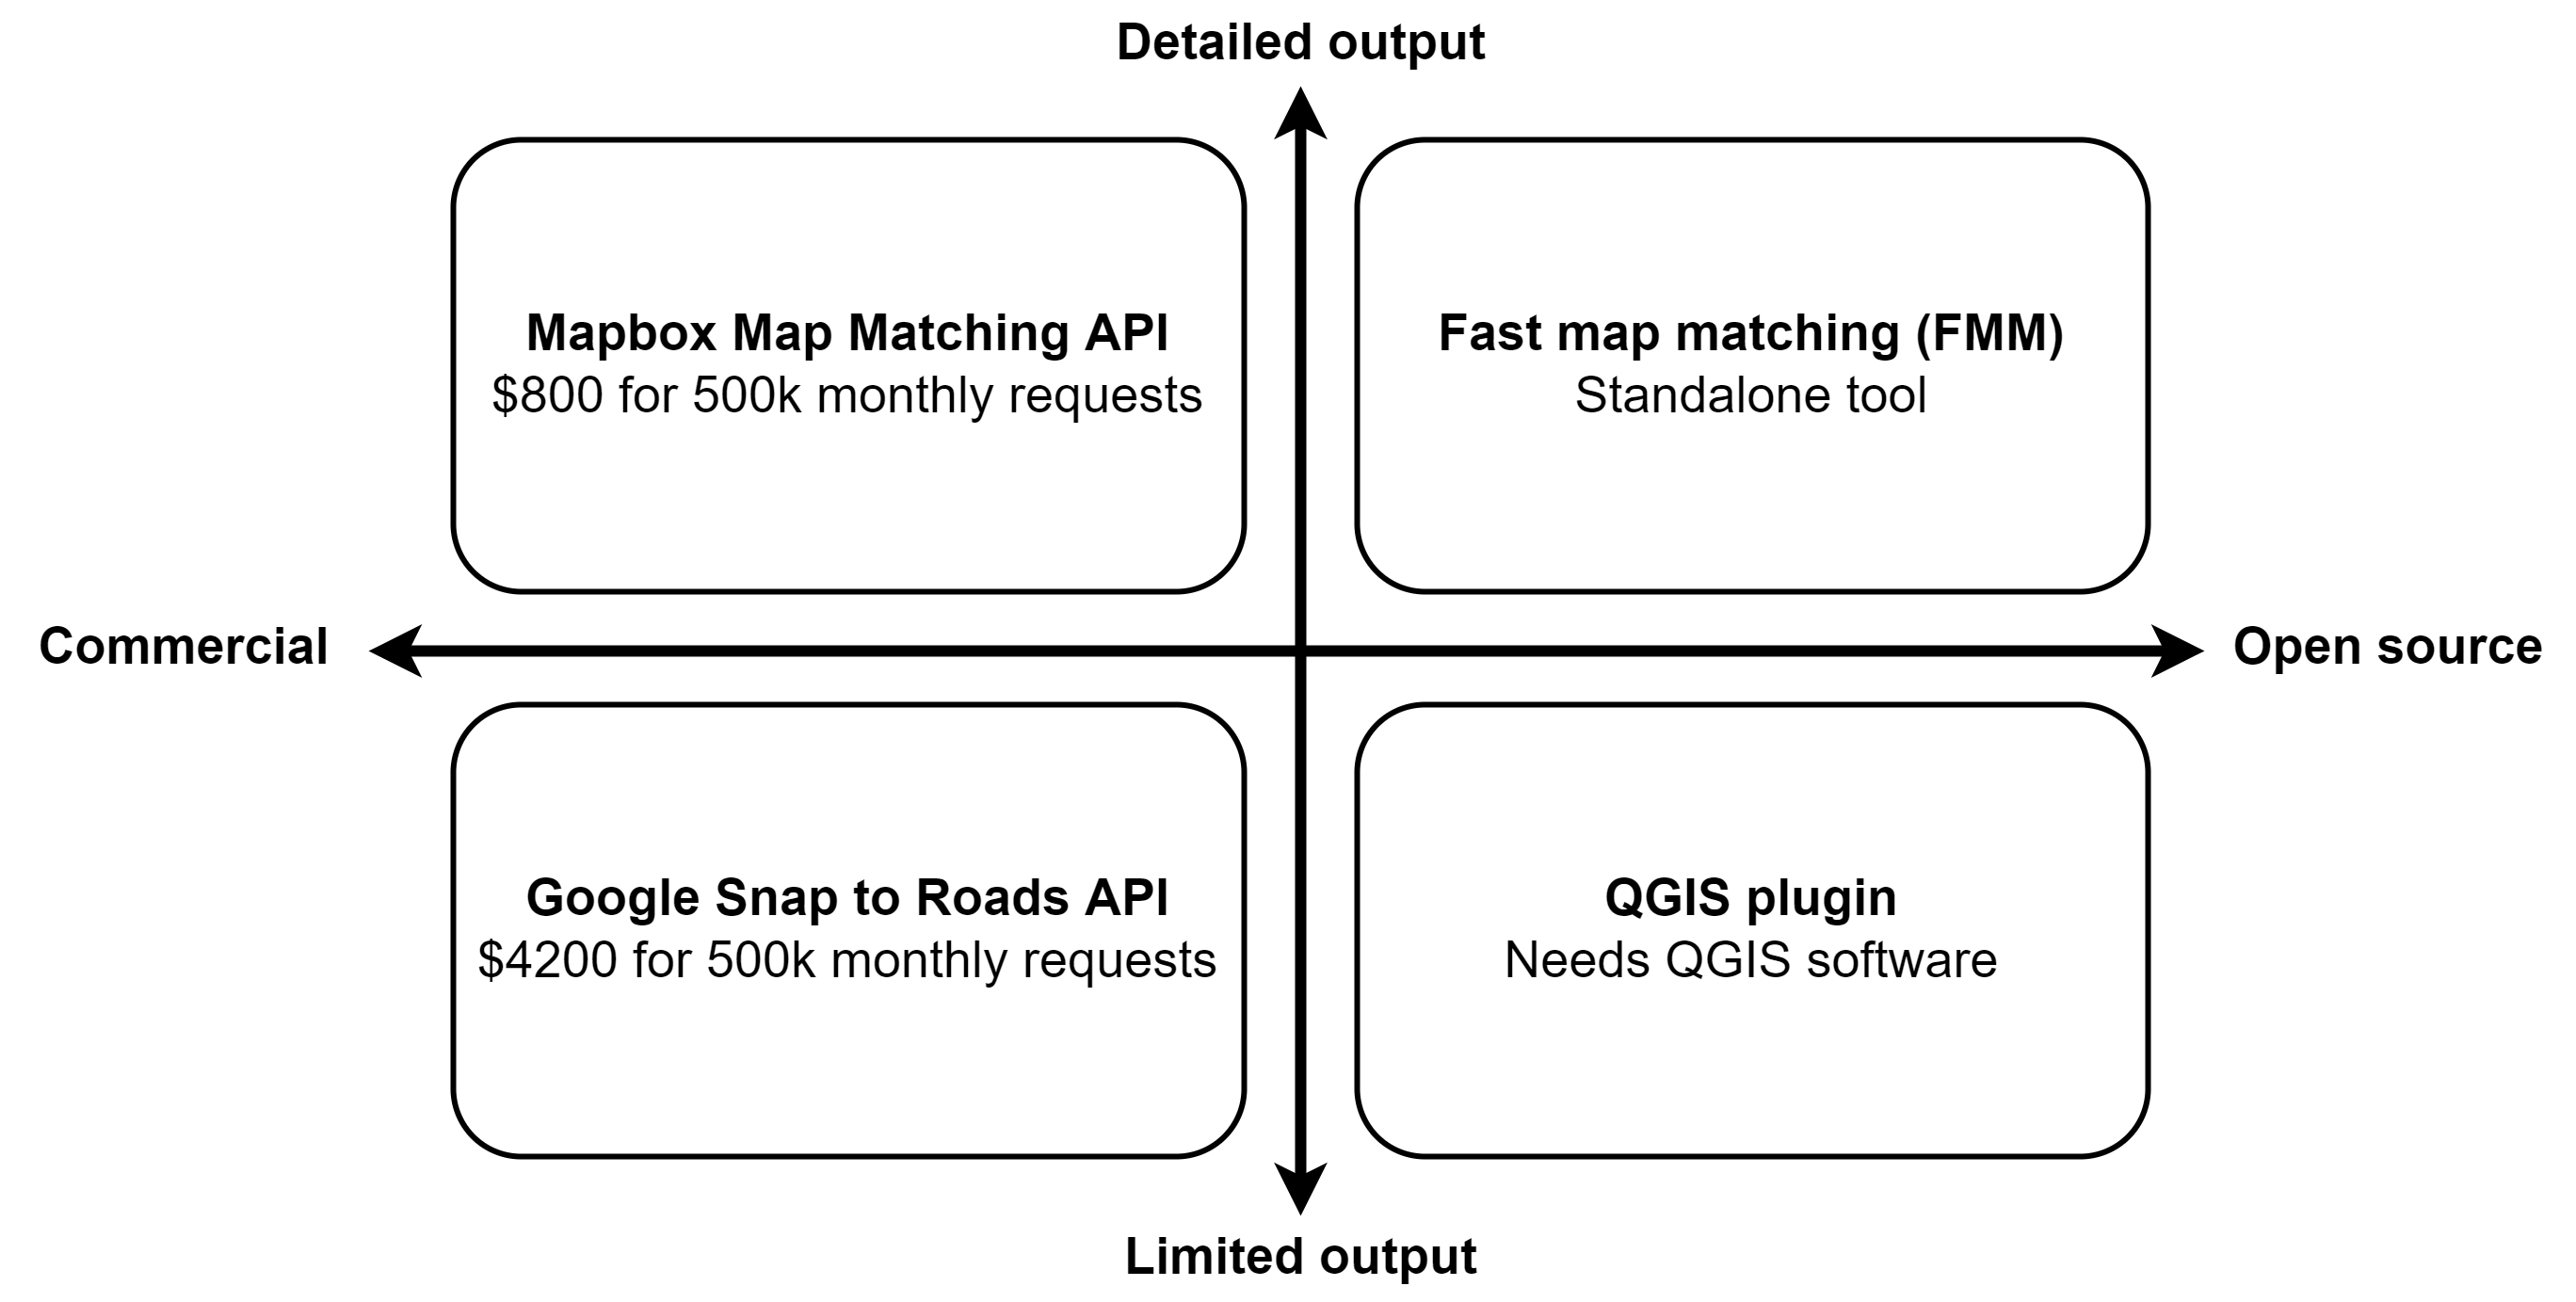
Hello, FMM!

Meet the fast map matching (FMM) tool
FMM tool overview
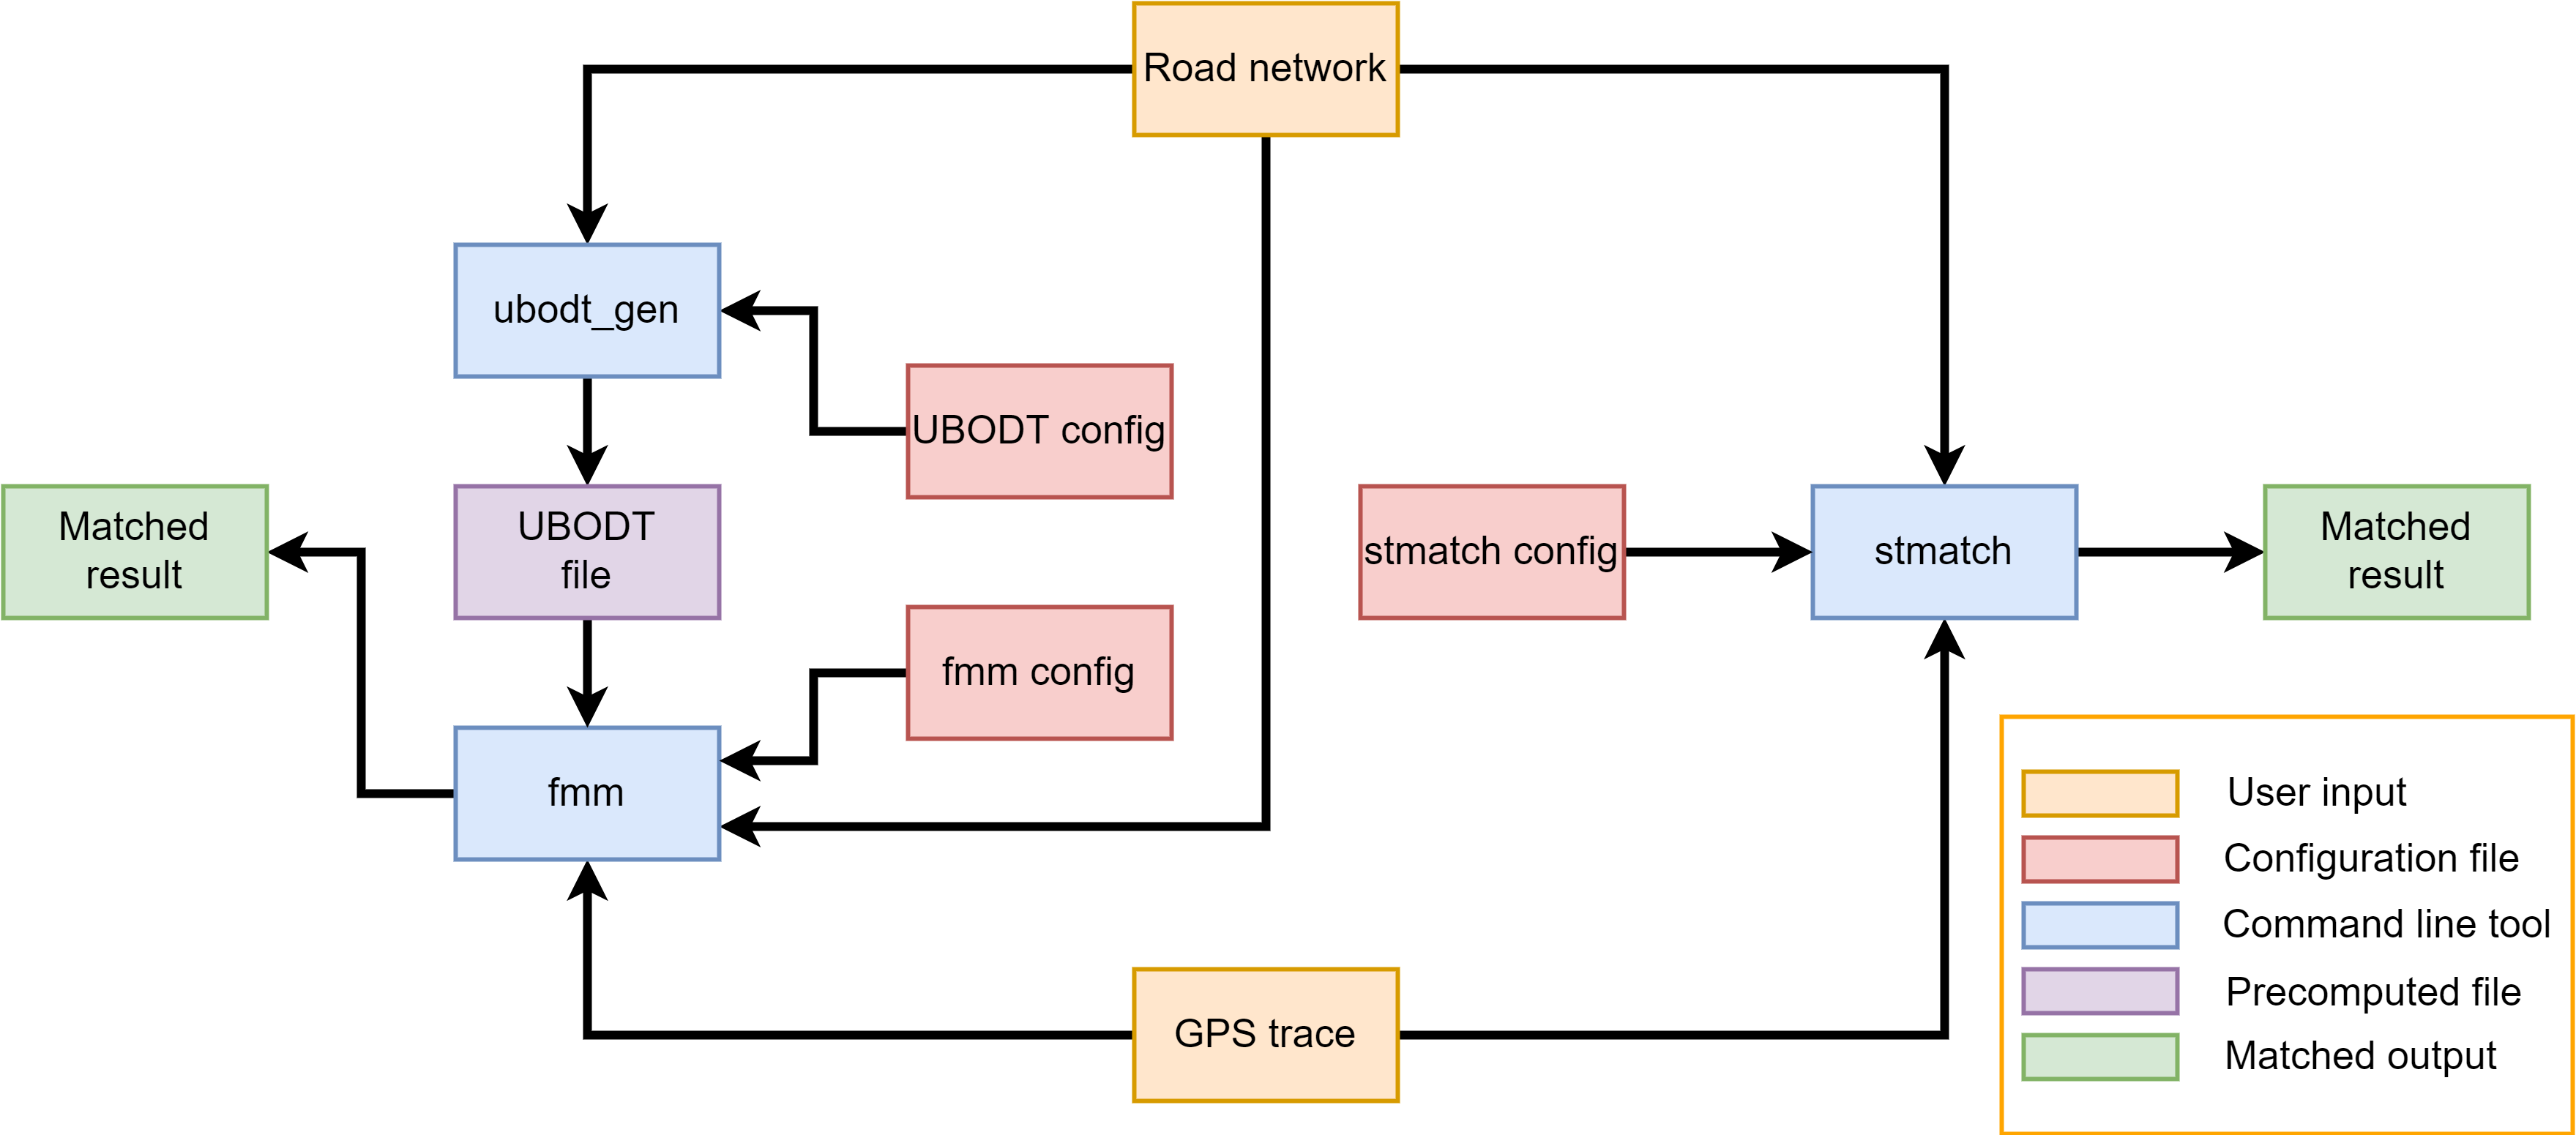
Input 1: Road network
Fields & definition:
| field | definition |
|---|---|
| id | ID of a line |
| source | source node ID |
| target | target node ID |

Input 2: GPS points
Fields & definition:
| field | definition |
|---|---|
| id | Trip ID |
| x | GPS longitude |
| y | GPS latitude |
| timestamp (optional) | Observation timestamp |
Additional notes:
- Each row has a single observation
- GPS points must be sorted by trip ID and timestamp
- Use
;as a delimiter
Valid example:
id;x;y;timestamp1;1.65889;0.25098;11;1.65494;0.70183;21;2.49336;1.76567;31;3.54929;1.88827;41;4.13064;2.45776;52;4.15042;1.60353;22;3.47019;0.92330;42;2.40635;0.92330;62;2.14533;1.53234;82;2.08601;2.57641;10Input 3: Upper Bounded Origin Destination Table (UBODT) file
Fields & definition:
| field | definition |
|---|---|
| source | Source node index |
| target | Target node index |
| next_n | Index of the node visited after the source node |
| prev_n | Index of the previous node visited before the target node |
| next_e | Index of the next edge visited after the source node |
| distance | Shortest path distance between the source and target nodes |
Note: UBODT file is only needed for the FMM tool
Valid example:
source;target;next_n;prev_n;next_e;distance0;6;4;7;4;30;10;4;5;4;30;8;4;5;4;30;9;4;4;4;20;7;4;4;4;20;4;4;0;4;10;12;4;9;4;30;1;1;0;0;10;5;4;4;4;21;9;0;4;1;31;7;0;4;1;31;4;0;0;1;21;5;0;4;1;31;0;0;1;1;1UBODT file is computed from the road network
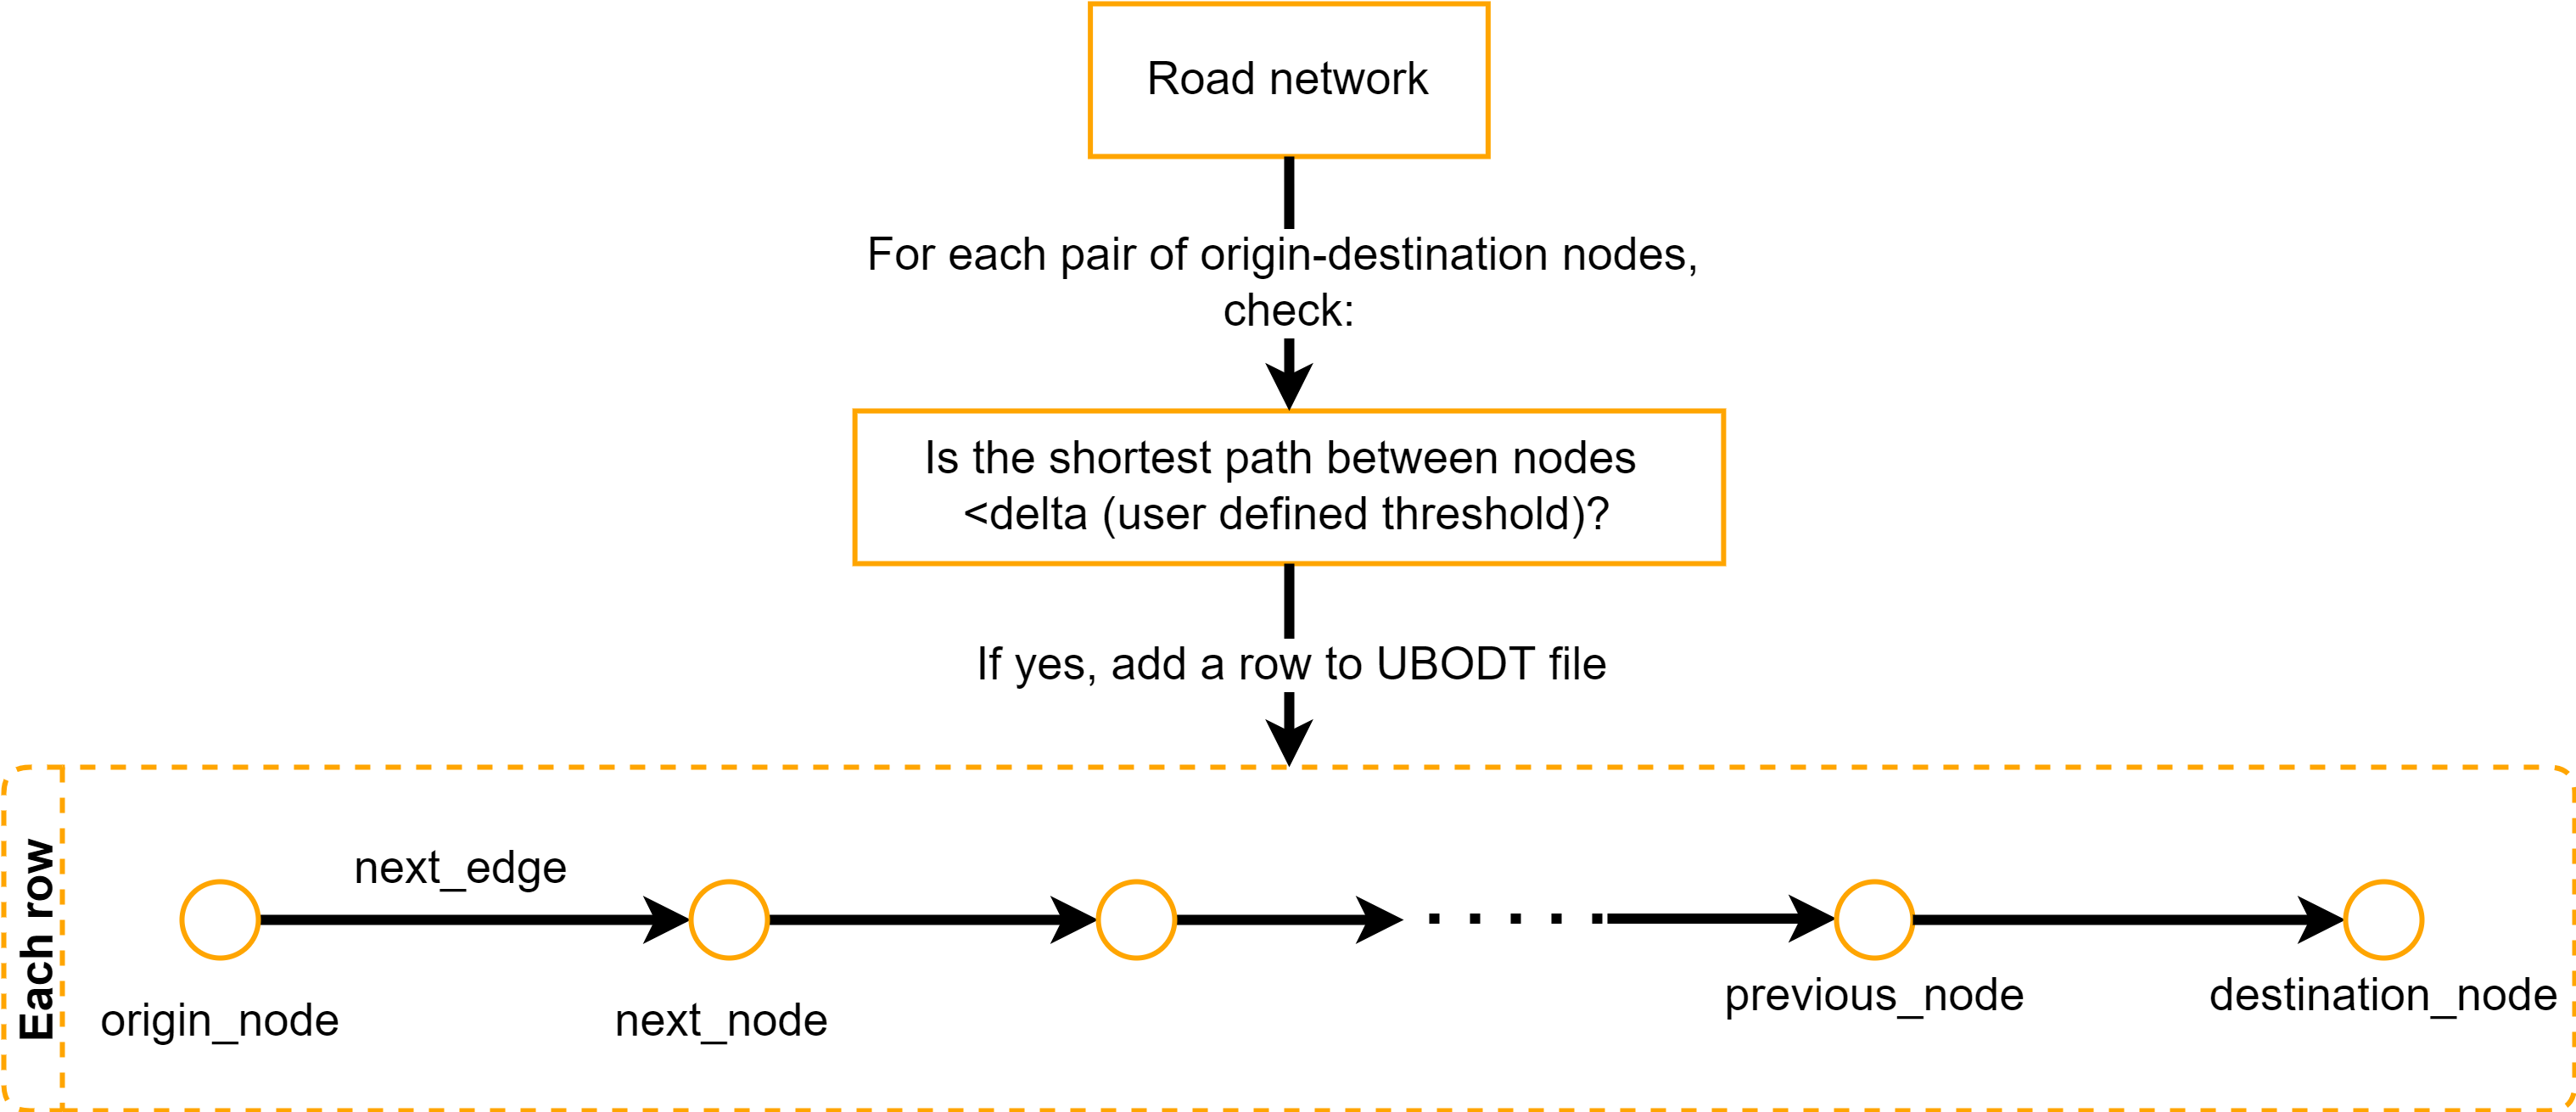
Input 4: Config files
UBODT config
<?xml version="1.0" encoding="utf-8"?><config> <input> <network> <file>../data/edges.shp</file> <id>id</id> <source>source</source> <target>target</target> </network> </input> <parameters> <delta>3</delta> </parameters> <output> <file>../data/ubodt.txt</file> </output></config>FMM config
<?xml version="1.0" encoding="utf-8"?><config> <input> <ubodt> <file>../data/ubodt.txt</file> </ubodt> <network> <file>../data/edges.shp</file> <id>id</id> </network> <gps> <file>../data/trips.shp</file> <id>id</id> </gps> </input> <parameters> <k>4</k> <r>0.4</r> <gps_error>0.5</gps_error> </parameters> <output> <file>mr.txt</file> </output></config>Output: Map matching result
| field | definition |
|---|---|
| ogeom | Original trajectory geometry |
| pgeom | A line connecting the matched points |
| mgeom | The geometry of the cpath |
| error | Distance from each point to its matched point |
| offset | Distance from the matched point to the start of the matched edge |
| spdist | Shortest path distances traversed between consecutive points |
| opath | Edge matched to each point in trajectory |
| cpath | The path traversed by the trajectory |
| tpath | Edges traversed between consecutive points |
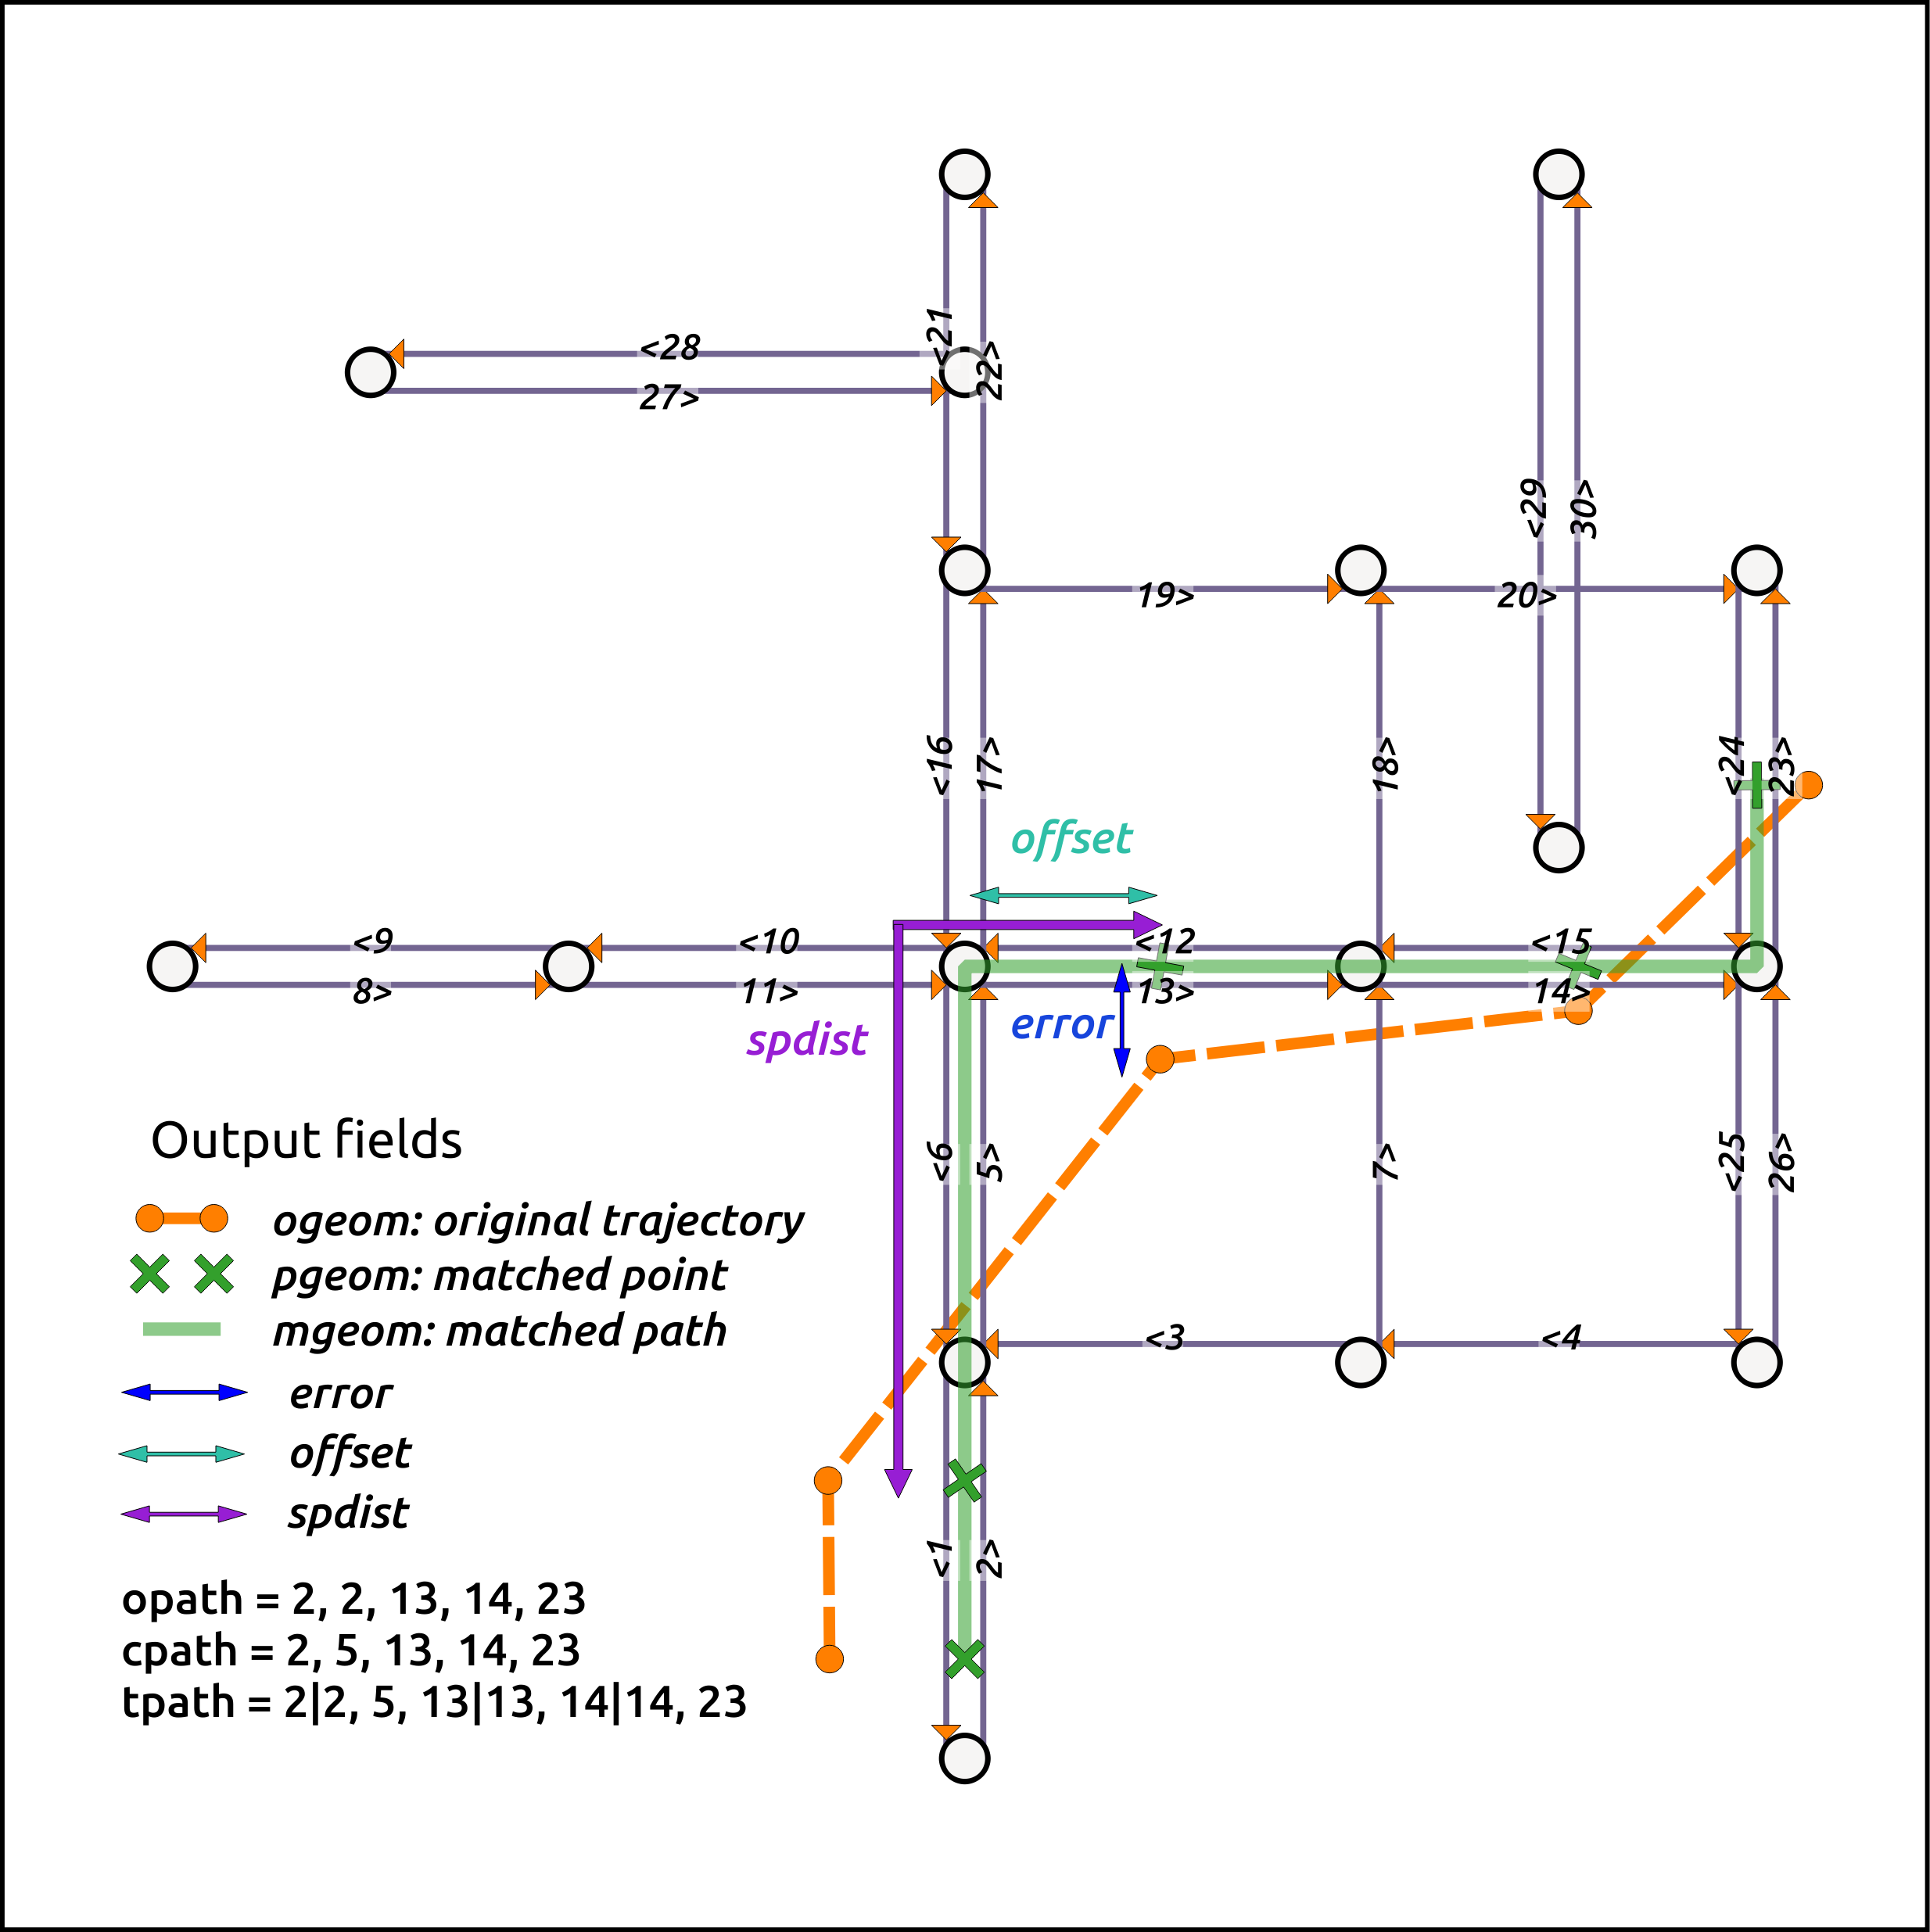
Intro to GIS basics
GIS file formats
| FORMAT | SHAPEFILE | GEOJSON | GEOPACKAGE |
|---|---|---|---|
| Age (years) | 30 | 10 | 5 |
| Compatibility | GIS | GIS, any text editor | GIS, SQL |
| Relative size | 1.00 | 2.26 | 1.30 |
| Compression ratio | 4.79:1 | 12.08:1 | 4.53:1 |
| QGIS performance | Good | Bad | Good |
| Use case | Old standard | Web, small data sets | New standard |
Road network sometimes has topological errors
| error | definition |
|---|---|
| Dangles | Lines that should be connected are disconnected |
| Switchbacks | A line has a bend in it |
| Knots/Loops | A line crosses itself or self-overlaps |
| Overshoots | A line extends past the line it should connect to |
| Undershoots | A line does not touch the line it should connect to |
![]()
Clean topological errors beforehand
GRASS GIS
R interface for GRASS
Check this tutorial
Import and visualize data
Import road network data
# Read Shapefileread_sf(here("data", "shapefile"))## Simple feature collection with 8 features and 1 field## Geometry type: LINESTRING## Dimension: XY## Bounding box: xmin: 568206.3 ymin: 4598184 xmax: 573136.6 ymax: 4602141## Projected CRS: NAD83 / UTM zone 15N## # A tibble: 8 x 2## road_id geometry## <chr> <LINESTRING [m]>## 1 52968114 (569107.4 4600923, 569162.5 4600924, 569200.6 4600924, 569223.6 4600~## 2 52968327 (570313.9 4600953, 570344.2 4600953, 570376.7 4600953, 570404.5 4600~## 3 52968853 (568206.3 4600914, 568264 4600914, 568314 4600914, 568366.6 4600913,~## 4 53033919 (569112.8 4600687, 569111.1 4600715, 569108.8 4600753, 569108.5 4600~## 5 53034396 (569107.4 4600923, 569107.1 4600943, 569104.2 4601125, 569102.1 4601~## 6 53034711 (569130.1 4599550, 569126.9 4599800, 569122.8 4599973, 569121.2 4600~## 7 53172262 (570350.5 4598184, 570348.7 4598267, 570345.9 4598386, 570342.5 4598~## 8 53172296 (570313.9 4600953, 570311.2 4601011, 570308.2 4601102, 570307.5 4601~Import road network data
# Read Shapefileread_sf(here("data", "shapefile")) -> network_shpImport road network data
# Read Shapefileread_sf(here("data", "shapefile")) -> network_shp# Read GeoJSONread_sf( here("data", "geojson", "network.geojson"))## Simple feature collection with 8 features and 1 field## Geometry type: MULTILINESTRING## Dimension: XY## Bounding box: xmin: 568206.3 ymin: 4598184 xmax: 573136.6 ymax: 4602141## Projected CRS: NAD83 / UTM zone 15N## # A tibble: 8 x 2## road_id geometry## <chr> <MULTILINESTRING [m]>## 1 52968114 ((569107.4 4600923, 569162.5 4600924, 569200.6 4600924, 569223.6 460~## 2 52968327 ((570313.9 4600953, 570344.2 4600953, 570376.7 4600953, 570404.5 460~## 3 52968853 ((568206.3 4600914, 568264 4600914, 568314 4600914, 568366.6 4600913~## 4 53033919 ((569112.8 4600687, 569111.1 4600715, 569108.8 4600753, 569108.5 460~## 5 53034396 ((569107.4 4600923, 569107.1 4600943, 569104.2 4601125, 569102.1 460~## 6 53034711 ((569130.1 4599550, 569126.9 4599800, 569122.8 4599973, 569121.2 460~## 7 53172262 ((570350.5 4598184, 570348.7 4598267, 570345.9 4598386, 570342.5 459~## 8 53172296 ((570313.9 4600953, 570311.2 4601011, 570308.2 4601102, 570307.5 460~Import road network data
# Read Shapefileread_sf(here("data", "shapefile")) -> network_shp# Read GeoJSONread_sf( here("data", "geojson", "network.geojson")) -> network_geojsonImport road network data
# Read Shapefileread_sf(here("data", "shapefile")) -> network_shp# Read GeoJSONread_sf( here("data", "geojson", "network.geojson")) -> network_geojson# Read GeoPackageread_sf( here("data", "geopackage", "network.gpkg"))## Simple feature collection with 8 features and 1 field## Geometry type: MULTILINESTRING## Dimension: XY## Bounding box: xmin: 568206.3 ymin: 4598184 xmax: 573136.6 ymax: 4602141## Projected CRS: NAD83 / UTM zone 15N## # A tibble: 8 x 2## road_id geom## <chr> <MULTILINESTRING [m]>## 1 52968114 ((569107.4 4600923, 569162.5 4600924, 569200.6 4600924, 569223.6 460~## 2 52968327 ((570313.9 4600953, 570344.2 4600953, 570376.7 4600953, 570404.5 460~## 3 52968853 ((568206.3 4600914, 568264 4600914, 568314 4600914, 568366.6 4600913~## 4 53033919 ((569112.8 4600687, 569111.1 4600715, 569108.8 4600753, 569108.5 460~## 5 53034396 ((569107.4 4600923, 569107.1 4600943, 569104.2 4601125, 569102.1 460~## 6 53034711 ((569130.1 4599550, 569126.9 4599800, 569122.8 4599973, 569121.2 460~## 7 53172262 ((570350.5 4598184, 570348.7 4598267, 570345.9 4598386, 570342.5 459~## 8 53172296 ((570313.9 4600953, 570311.2 4601011, 570308.2 4601102, 570307.5 460~Import road network data
# Read Shapefileread_sf(here("data", "shapefile")) -> network_shp# Read GeoJSONread_sf( here("data", "geojson", "network.geojson")) -> network_geojson# Read GeoPackageread_sf( here("data", "geopackage", "network.gpkg")) -> network_gpkgVisualize road network
mapview(network_geojson)




52968327
52968853
53033919
53034396
53034711
53172262
53172296
Import GPS data
gps <- read_csv( here("data", "gps.csv"), show_col_types = FALSE) gps## # A tibble: 38 x 4## sequence speed_mph longitude latitude## <dbl> <dbl> <dbl> <dbl>## 1 1 5.90 -92.2 41.6## 2 2 5.50 -92.2 41.6## 3 3 5.21 -92.2 41.6## 4 4 9.37 -92.2 41.6## 5 5 13.4 -92.2 41.6## 6 6 12.1 -92.2 41.6## 7 7 13.0 -92.2 41.6## 8 8 13.4 -92.2 41.6## 9 9 11.6 -92.2 41.6## 10 10 10.6 -92.2 41.6## # ... with 28 more rowsImport GPS data
gps <- read_csv( here("data", "gps.csv"), show_col_types = FALSE) %>% st_as_sf( coords = c("longitude", "latitude"), crs = 4326 # WGS 84 )gps## Simple feature collection with 38 features and 2 fields## Geometry type: POINT## Dimension: XY## Bounding box: xmin: -92.16488 ymin: 41.55675 xmax: -92.15668 ymax: 41.56208## Geodetic CRS: WGS 84## # A tibble: 38 x 3## sequence speed_mph geometry## * <dbl> <dbl> <POINT [°]>## 1 1 5.90 (-92.16488 41.557)## 2 2 5.50 (-92.16471 41.55698)## 3 3 5.21 (-92.16432 41.55699)## 4 4 9.37 (-92.16412 41.55698)## 5 5 13.4 (-92.16378 41.55697)## 6 6 12.1 (-92.16342 41.55698)## 7 7 13.0 (-92.16302 41.55699)## 8 8 13.4 (-92.16263 41.55701)## 9 9 11.6 (-92.1623 41.557)## 10 10 10.6 (-92.16199 41.55698)## # ... with 28 more rowsImport GPS data
gps <- read_csv( here("data", "gps.csv"), show_col_types = FALSE) %>% st_as_sf( coords = c("longitude", "latitude"), crs = 4326 # WGS 84 ) %>% st_transform(26915) # NAD83 / UTM zone 15Ngps## Simple feature collection with 38 features and 2 fields## Geometry type: POINT## Dimension: XY## Bounding box: xmin: 569640.7 ymin: 4600905 xmax: 570320 ymax: 4601499## Projected CRS: NAD83 / UTM zone 15N## # A tibble: 38 x 3## sequence speed_mph geometry## * <dbl> <dbl> <POINT [m]>## 1 1 5.90 (569640.7 4600930)## 2 2 5.50 (569654.5 4600928)## 3 3 5.21 (569687 4600928)## 4 4 9.37 (569703.7 4600927)## 5 5 13.4 (569732.3 4600927)## 6 6 12.1 (569762.1 4600928)## 7 7 13.0 (569796 4600930)## 8 8 13.4 (569828.1 4600932)## 9 9 11.6 (569855.7 4600931)## 10 10 10.6 (569881.7 4600929)## # ... with 28 more rowsVisualize GPS data
mapview(network_geojson)


52968327
52968853
53033919
53034396
53034711
53172262
53172296
Visualize GPS data
mapview(network_geojson) + mapview(gps)


52968327
52968853
53033919
53034396
53034711
53172262
53172296
Hello, mapmatchr!
Helper functions
Helper function 1: Transform network
reveal <- args(.transform_network)reveal## function (network, output = "network") ## NULLHelper function 1: Transform network
reveal <- args(.transform_network)reveal <- network_geojsonreveal## Simple feature collection with 8 features and 1 field## Geometry type: MULTILINESTRING## Dimension: XY## Bounding box: xmin: 568206.3 ymin: 4598184 xmax: 573136.6 ymax: 4602141## Projected CRS: NAD83 / UTM zone 15N## # A tibble: 8 x 2## road_id geometry## <chr> <MULTILINESTRING [m]>## 1 52968114 ((569107.4 4600923, 569162.5 4600924, 569200.6 4600924, 569223.6 460~## 2 52968327 ((570313.9 4600953, 570344.2 4600953, 570376.7 4600953, 570404.5 460~## 3 52968853 ((568206.3 4600914, 568264 4600914, 568314 4600914, 568366.6 4600913~## 4 53033919 ((569112.8 4600687, 569111.1 4600715, 569108.8 4600753, 569108.5 460~## 5 53034396 ((569107.4 4600923, 569107.1 4600943, 569104.2 4601125, 569102.1 460~## 6 53034711 ((569130.1 4599550, 569126.9 4599800, 569122.8 4599973, 569121.2 460~## 7 53172262 ((570350.5 4598184, 570348.7 4598267, 570345.9 4598386, 570342.5 459~## 8 53172296 ((570313.9 4600953, 570311.2 4601011, 570308.2 4601102, 570307.5 460~Helper function 1: Transform network
reveal <- args(.transform_network)reveal <- network_geojson %>% .transform_network()reveal## Simple feature collection with 16 features and 3 fields## Geometry type: LINESTRING## Dimension: XY## Bounding box: xmin: 568206.3 ymin: 4598184 xmax: 573136.6 ymax: 4602141## Projected CRS: NAD83 / UTM zone 15N## # A tibble: 16 x 4## id source target geometry## <int> <int> <int> <LINESTRING [m]>## 1 1 1 2 (569107.4 4600923, 569162.5 4600924, 569200.6 4600924, 5~## 2 2 2 1 (570313.9 4600953, 570298.5 4600952, 570268.8 4600952, 5~## 3 3 2 3 (570313.9 4600953, 570344.2 4600953, 570376.7 4600953, 5~## 4 4 3 2 (573136.6 4600571, 573123.6 4600570, 573097.6 4600570, 5~## 5 5 1 4 (569107.4 4600923, 569078.3 4600922, 569046.9 4600920, 5~## 6 6 4 1 (568206.3 4600914, 568264 4600914, 568314 4600914, 56836~## 7 7 1 5 (569107.4 4600923, 569108.5 4600836, 569108.8 4600753, 5~## 8 8 5 1 (569112.8 4600687, 569111.1 4600715, 569108.8 4600753, 5~## 9 9 1 6 (569107.4 4600923, 569107.1 4600943, 569104.2 4601125, 5~## 10 10 6 1 (569100.9 4601360, 569102.1 4601298, 569104.2 4601125, 5~## 11 11 7 8 (569130.1 4599550, 569126.9 4599800, 569122.8 4599973, 5~## 12 12 8 7 (569112.8 4600687, 569119.2 4600364, 569121.2 4600097, 5~## 13 13 2 9 (570313.9 4600953, 570315.1 4600927, 570320.4 4600846, 5~## 14 14 9 2 (570350.5 4598184, 570348.7 4598267, 570345.9 4598386, 5~## 15 15 2 10 (570313.9 4600953, 570311.2 4601011, 570308.2 4601102, 5~## 16 16 10 2 (570294.9 4602141, 570294.9 4602141, 570297.5 4601979, 5~Helper function 1: Transform network
reveal <- args(.transform_network)reveal <- network_geojson %>% .transform_network()reveal <- network_geojson %>% .transform_network(output = "join_key")reveal## # A tibble: 16 x 2## id road_id ## * <int> <chr> ## 1 1 52968114## 2 2 52968114## 3 3 52968327## 4 4 52968327## 5 5 52968853## 6 6 52968853## 7 7 53033919## 8 8 53033919## 9 9 53034396## 10 10 53034396## 11 11 53034711## 12 12 53034711## 13 13 53172262## 14 14 53172262## 15 15 53172296## 16 16 53172296Helper function 1: Transform network
reveal <- args(.transform_network)reveal <- network_geojson %>% .transform_network()reveal <- network_geojson %>% .transform_network(output = "join_key")reveal <- network_geojson %>% .transform_network(output = "both")reveal## $network## Simple feature collection with 16 features and 3 fields## Geometry type: LINESTRING## Dimension: XY## Bounding box: xmin: 568206.3 ymin: 4598184 xmax: 573136.6 ymax: 4602141## Projected CRS: NAD83 / UTM zone 15N## # A tibble: 16 x 4## id source target geometry## <int> <int> <int> <LINESTRING [m]>## 1 1 1 2 (569107.4 4600923, 569162.5 4600924, 569200.6 4600924, 5~## 2 2 2 1 (570313.9 4600953, 570298.5 4600952, 570268.8 4600952, 5~## 3 3 2 3 (570313.9 4600953, 570344.2 4600953, 570376.7 4600953, 5~## 4 4 3 2 (573136.6 4600571, 573123.6 4600570, 573097.6 4600570, 5~## 5 5 1 4 (569107.4 4600923, 569078.3 4600922, 569046.9 4600920, 5~## 6 6 4 1 (568206.3 4600914, 568264 4600914, 568314 4600914, 56836~## 7 7 1 5 (569107.4 4600923, 569108.5 4600836, 569108.8 4600753, 5~## 8 8 5 1 (569112.8 4600687, 569111.1 4600715, 569108.8 4600753, 5~## 9 9 1 6 (569107.4 4600923, 569107.1 4600943, 569104.2 4601125, 5~## 10 10 6 1 (569100.9 4601360, 569102.1 4601298, 569104.2 4601125, 5~## 11 11 7 8 (569130.1 4599550, 569126.9 4599800, 569122.8 4599973, 5~## 12 12 8 7 (569112.8 4600687, 569119.2 4600364, 569121.2 4600097, 5~## 13 13 2 9 (570313.9 4600953, 570315.1 4600927, 570320.4 4600846, 5~## 14 14 9 2 (570350.5 4598184, 570348.7 4598267, 570345.9 4598386, 5~## 15 15 2 10 (570313.9 4600953, 570311.2 4601011, 570308.2 4601102, 5~## 16 16 10 2 (570294.9 4602141, 570294.9 4602141, 570297.5 4601979, 5~## ## $join_key## # A tibble: 16 x 2## id road_id ## * <int> <chr> ## 1 1 52968114## 2 2 52968114## 3 3 52968327## 4 4 52968327## 5 5 52968853## 6 6 52968853## 7 7 53033919## 8 8 53033919## 9 9 53034396## 10 10 53034396## 11 11 53034711## 12 12 53034711## 13 13 53172262## 14 14 53172262## 15 15 53172296## 16 16 53172296Helper function 1b: Visualize transformed network
reveal <- args(.viz_transformed_network)reveal## function (network) ## NULLHelper function 1b: Visualize transformed network
reveal <- args(.viz_transformed_network)reveal <- network_geojson %>% .viz_transformed_network()reveal




52968327
52968853
53033919
53034396
53034711
53172262
53172296


Helper function 2: Transform GPS
reveal <- args(.transform_gps)reveal## function (gps) ## NULLHelper function 2: Transform GPS
reveal <- args(.transform_gps)reveal <- gpsreveal## Simple feature collection with 38 features and 2 fields## Geometry type: POINT## Dimension: XY## Bounding box: xmin: 569640.7 ymin: 4600905 xmax: 570320 ymax: 4601499## Projected CRS: NAD83 / UTM zone 15N## # A tibble: 38 x 3## sequence speed_mph geometry## * <dbl> <dbl> <POINT [m]>## 1 1 5.90 (569640.7 4600930)## 2 2 5.50 (569654.5 4600928)## 3 3 5.21 (569687 4600928)## 4 4 9.37 (569703.7 4600927)## 5 5 13.4 (569732.3 4600927)## 6 6 12.1 (569762.1 4600928)## 7 7 13.0 (569796 4600930)## 8 8 13.4 (569828.1 4600932)## 9 9 11.6 (569855.7 4600931)## 10 10 10.6 (569881.7 4600929)## # ... with 28 more rowsHelper function 2: Transform GPS
reveal <- args(.transform_gps)reveal <- gps %>% .transform_gps()reveal## # A tibble: 38 x 3## id x y## <dbl> <dbl> <dbl>## 1 1 569641. 4600930.## 2 1 569654. 4600928.## 3 1 569687. 4600928.## 4 1 569704. 4600927.## 5 1 569732. 4600927.## 6 1 569762. 4600928.## 7 1 569796. 4600930.## 8 1 569828. 4600932.## 9 1 569856. 4600931.## 10 1 569882. 4600929.## # ... with 28 more rowsHelper function 3: Define UBODT config
reveal <- args(.define_ubodt_config)reveal## function (network_file, output_file, use_omp = FALSE, ...) ## NULLHelper function 3: Define UBODT config
reveal <- args(.define_ubodt_config)reveal <- .define_ubodt_config( network_file = "edges.shp", output_file = "ubodt.txt") reveal## {xml_document}## <config>## [1] <input>\n <network>\n <file>edges.shp</file>\n <id>id</id>\n <s ...## [2] <parameters>\n <delta>3000</delta>\n</parameters>## [3] <output>\n <file>ubodt.txt</file>\n</output>## [4] <other>\n <log_level>2</log_level>\n</other>Helper function 3: Define UBODT config
reveal <- args(.define_ubodt_config)reveal <- .define_ubodt_config( network_file = "edges.shp", output_file = "ubodt.txt") %>% message()reveal## <?xml version="1.0" encoding="UTF-8"?>## <config>## <input>## <network>## <file>edges.shp</file>## <id>id</id>## <source>source</source>## <target>target</target>## </network>## </input>## <parameters>## <delta>3000</delta>## </parameters>## <output>## <file>ubodt.txt</file>## </output>## <other>## <log_level>2</log_level>## </other>## </config>## NULLHelper function 4: Define map match config
reveal <- args(.define_map_match_config)reveal## function (network_file, gps_file, output_file, match_method = "fmm", ## ubodt_file = NULL, gps_point = TRUE, use_omp = FALSE, ...) ## NULLHelper function 4: Define map match config
reveal <- args(.define_map_match_config)reveal <- .define_map_match_config( network_file = "edges.shp", gps_file = "trips.csv", output_file = "mr.txt", ubodt_file = "ubodt.txt") reveal## {xml_document}## <config>## [1] <input>\n <network>\n <file>edges.shp</file>\n <id>id</id>\n <s ...## [2] <parameters>\n <k>8</k>\n <r>300</r>\n <gps_error>50</gps_error>\n</pa ...## [3] <output>\n <file>mr.txt</file>\n <fields>\n <all/>\n </fields>\n</o ...## [4] <other>\n <log_level>2</log_level>\n <step>100</step>\n</other>Helper function 4: Define map match config
reveal <- args(.define_map_match_config)reveal <- .define_map_match_config( network_file = "edges.shp", gps_file = "trips.csv", output_file = "mr.txt", ubodt_file = "ubodt.txt") %>% message()reveal## <?xml version="1.0" encoding="UTF-8"?>## <config>## <input>## <network>## <file>edges.shp</file>## <id>id</id>## <source>source</source>## <target>target</target>## </network>## <gps>## <file>trips.csv</file>## <id>id</id>## <x>x</x>## <y>y</y>## <timestamp>timestamp</timestamp>## <gps_point/>## </gps>## <ubodt>## <file>ubodt.txt</file>## </ubodt>## </input>## <parameters>## <k>8</k>## <r>300</r>## <gps_error>50</gps_error>## </parameters>## <output>## <file>mr.txt</file>## <fields>## <all/>## </fields>## </output>## <other>## <log_level>2</log_level>## <step>100</step>## </other>## </config>## NULLMain functions
Main function: Snap GPS traces
snap_res <- args(snap_gps_traces)snap_res## function (network, gps, match_method = "fmm", delta = 3000, candidates = 8, ## radius = 300, gps_error = 50, gps_point = TRUE, use_omp = FALSE, ## ubodt_config = NULL, match_config = NULL) ## NULLMain function: Snap GPS traces
snap_res <- args(snap_gps_traces)snap_res <- read_delim( here("data", "snap-output.txt"), delim = ";", col_types = cols(.default = "c")) %>% glimpse()snap_res## Rows: 1## Columns: 14## $ id <chr> "1"## $ opath <chr> "1,1,1,1,1,1,1,1,1,1,1,1,1,1,1,1,1,1,1,1,1,1,1,1,1,53,53,53,5~## $ error <chr> "4.20159,6.32479,6.35744,7.67548,8.22134,7.44478,5.49602,3.04~## $ offset <chr> "533.694,547.488,579.928,596.593,625.213,655.111,689.051,721.~## $ spdist <chr> "13.7941,32.4399,16.6654,28.6198,29.8974,33.9405,32.0662,27.6~## $ pgeom <chr> "LINESTRING(569640.65 4600933.70142,569654.443551 4600933.824~## $ cpath <chr> "1,53"## $ tpath <chr> "1|1|1|1|1|1|1|1|1|1|1|1|1|1|1|1|1|1|1|1|1|1|1|1|1,53|53|53|5~## $ mgeom <chr> "LINESTRING(569640.65 4600933.70142,569663.005055 4600933.900~## $ ep <chr> "0.996475558307,0.9920313364,0.991949166576,0.988286544171,0.~## $ tp <chr> "0,1,1,1,1,0.995631130634,1,1,1,1,1,1,1,1,1,1,0.875954091182,~## $ length <chr> "1207.84590729,1207.84590729,1207.84590729,1207.84590729,1207~## $ duration <chr> NA## $ speed <chr> NA## # A tibble: 1 x 14## id opath error offset spdist pgeom cpath tpath mgeom ep tp length## <chr> <chr> <chr> <chr> <chr> <chr> <chr> <chr> <chr> <chr> <chr> <chr> ## 1 1 1,1,1,1,~ 4.20~ 533.6~ 13.79~ LINE~ 1,53 1|1|~ LINE~ 0.99~ 0,1,~ 1207.~## # ... with 2 more variables: duration <chr>, speed <chr>Main function: Visualize snap output
reveal <- args(viz_snap_output_geom)reveal## function (gps, snap_output) ## NULLMain function: Visualize snap output
reveal <- args(viz_snap_output_geom)reveal <- viz_snap_output_geom(gps, snap_res)reveal




Main function: Visualize snap output
reveal <- args(viz_snap_output_num)reveal## function (snap_output) ## NULLThings to do
- Create the package
- Design logo
- Write function to automate fmm installation
- Write paper for submission to Elsevier's SoftwareX
Acknowledgements
This work was funded by the Centers for Disease Control and Prevention (U54 OH 007548). Its contents are solely the responsibility of the authors and do not necessarily represent the official views of the Centers for Disease Control and Prevention or the Department of Health and Human Services.